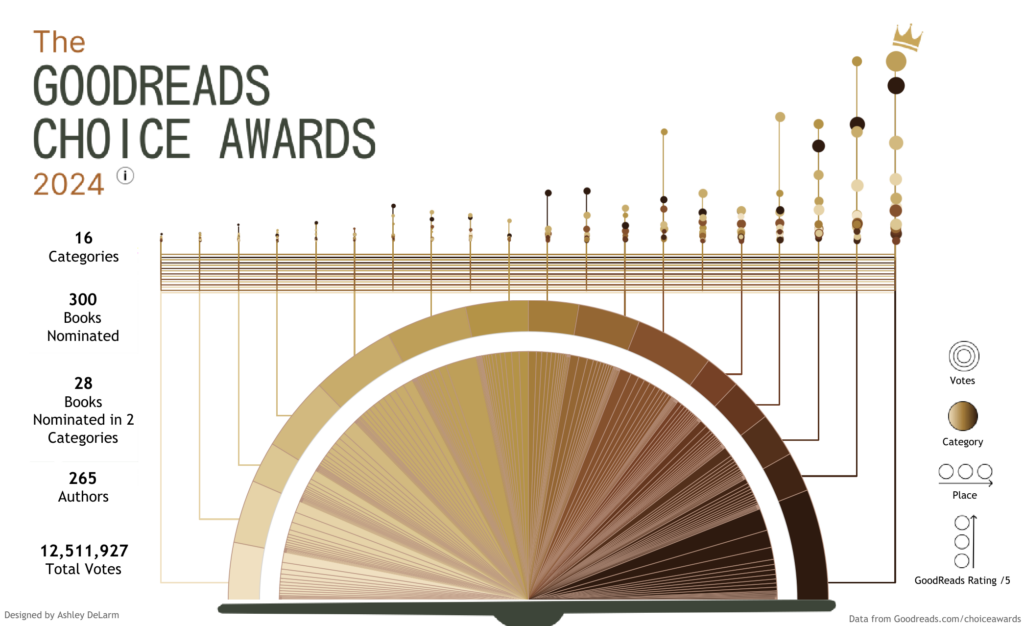
This interactive data visualization spoke to me while searching on Tableau Public. It displays the books that were nominated for The GoodReads Choice Awards. The books with more votes have a larger circle in the top visualization and have more space around them in the bottom visualization, which resembles a pie chart. The nominations are broken down by category, with each color in the pie chart representing a different category. The visualization is successful in including lots of information in one place. It contains data on each book’s category, author, rating in the app, and the votes it received. Without the visualization, it would be difficult to simultaneously compare the votes within and across the different categories. I think that the pie chart visualization on the bottom suits the data as it able to display the large quantity on data. However, the colors in the pie chart are hard to discern from one another, which makes it inaccessible. The top visualization is not as effective as many of the data points are overlapping and cannot be seen. However, I cannot think of a visualization style that could visualize this large amount data more effectively.
The visualization was made by Ashley DeLarm. Ashley is a senior business intelligence analyst at Discovery Services. She graduated from Drake University Graduate with a B.S. in Computer Science, a B.S. in Data Analytics, and a minor in Artificial Intelligence. She posted the visualization on her public Tableau profile to showcase her work. It is difficult to discern whether or not data visualization is a side passion for DeLarm or if it is a part of her analysis work at Discovery Services as another one of her visualizations on Tableau is about the rise of Chapell Roan. Because I cannot tell the context in which she creates her work, it is difficult to know who her audience is. Without having looked at her other work or her job title, I would assume that the audience is GoodReads users as they were the ones who were voting on the data that is displayed.
The source of the data is this page on GoodReads for the book awards. The data on this page is unstructured. The only potential bias that could be included in this visualization is the colors that are associated with each category as the categories are not listed in alphabetical or numerical order (by total votes). The colors could represent a hierarchy and the categories that Ashley prefers could be assigned darker shades, indicating importance. DeLarm could compare the votes for books by male vs feamle authors in each category as another application of this data set. This would require more complex visualizations.
